- Income Statistics
- Average PTO Days
- What Percentage of Americans Live Paycheck to Paycheck?
- Average American Income
- Millionaire Statistics
- Average Salary out of College
- Average Bonus Statistics
- Minimum Wage Statistics
- Union Benefits Statistics
- Savings Statistics
- Average Annual Raise
- Income Inequality Statistics
- How Many People Make Over 100k?
- Average 401(k) Sstatistics
- Average Net Worth Statistics
- $100k After-Tax Income By State
- Average Global Income
Research Summary. While the average American income depends heavily on the industry, field, and experience, you might be surprised to learn how your income stacks up against the rest of the country. According to our extensive research:
-
The average personal income in the U.S. is $63,214.
-
The median income in the U.S. is $44,225.
-
The average American annual real wage was $67,521 in 2020.
-
The average U.S. household income is $87,864.
-
The median U.S. household income is $61,937.
For further analysis, we broke down the data in the following ways:
Demographics | Real Wage | Poverty | Bracket | Trends and Predictions | State
Average American Income by Gender
Unless you’ve been living on a remote island in the Pacific, you’ve likely heard of the gender pay gap and other workplace controversies related to gender.
While there are many factors that go into income differences between men and women, including industry preferences, work-life-balances choices, and more, the fact is that the average female worker still makes less than the average male worker. Our research shows that:
-
In the United States, the average woman earns a median income of $42,238, while her male counterpart earns $52,004.
That’s a difference of around $8,000, which is significant.
Of course, it’s important to keep in mind that these average incomes are based on all workers across all industries, meaning that the demographic abundance of female workers in a lower-income industry or the abundance of male workers in a higher-income industry can easily skew these averages.
-
However, even in similar fields with similar qualifications, women earn 84% of what men earn.
While this 2020 number is lower than the 77% cited a few years prior, there is still a considerable gap between men and women. Fortunately, those in younger generations do have a noticeably smaller gap, with women between the ages of 25 to 34 earning 93 cents for every dollar a man makes.
-
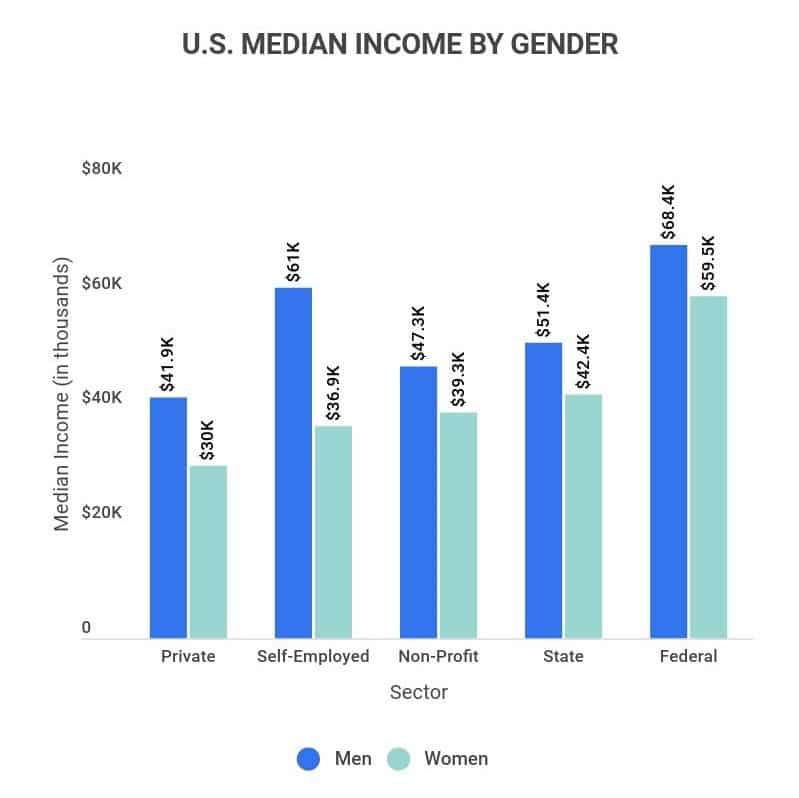
There’s a huge gap between male and female business owners, with men earning 40% more than their female counterparts.
The average self-employed man earns $61,091 per year, while the average self-employed woman earns only $36,995 per year. This is by far the worst disparity in income between men and women.
-
In 1979, the average woman earned only 61.5% of a man’s weekly earnings.
That’s the difference between an average of $408 per week for men, compared to $251 for women. Today, that gap has shrunk by over 20 percentage points, with the average woman earning $916 per week and the average man earning $1,100.
Average American Income by Demographics
While the non-Hispanic/Latino White population is by far the highest in the U.S., at 60%, this group doesn’t earn the highest income. In fact, there are several demographic factors that go into income, such as age, sector, etc. When it comes to the demographics of the average American income, our research shows that:
-
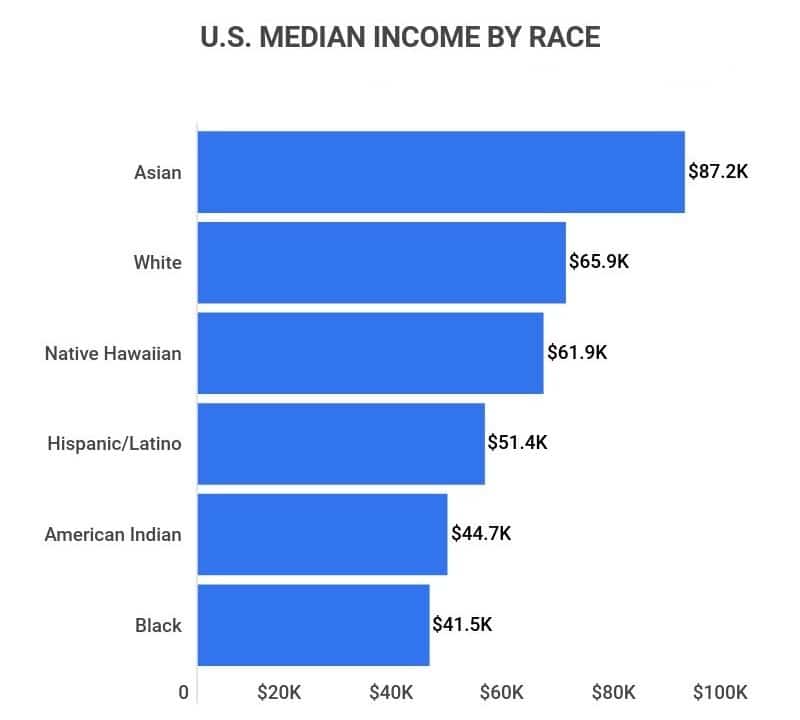
Asian Americans earn the highest median income of $87,243.
That’s over $20,000 more than White Americans, who are the second-highest earners in the country. This disparity is likely the result of two main factors. First, Asian Americans are one of the highest-growing demographics in the U.S., and second, Asian Americans are also the most educated demographic.
-
Black Americans have the lowest median income of $41,511.
Which is nearly $25,000 less than the average White American and less than half that of the average Asian American.
-
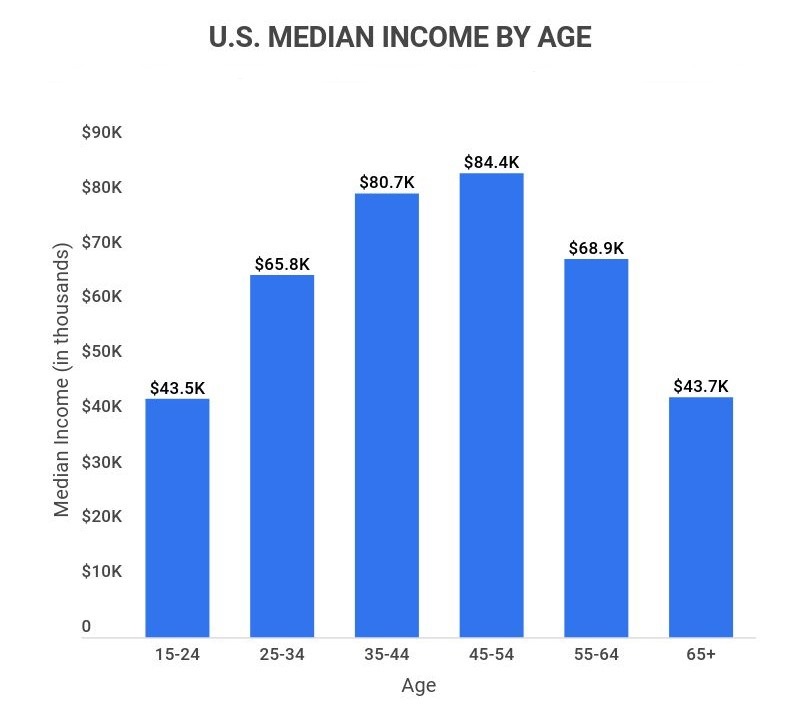
Those between the ages of 45-54 earn the highest incomes, at a median of $84,464.
Close behind in second place are those aged 35-44, who have a median income of $80,743. This makes sense, as employees are typically at the height of their careers at this age.
-
Those between the ages of 15-24 earn the lowest incomes, at a median of only $43,531.
The oldest demographic (65+) has the second-lowest median income of $43,696. These two demographics have the lowest median income because they are either at the beginning or very end of their career.
-
Men who work for the federal government have the highest median income of any sector, at $68,464.
However, women in the same sector only make $59,581 on average, which is still the highest overall, but lower than their male counterparts.
-
Women who work for the private sector have the lowest median income, at $30,040.
That’s over $11,000 less than their male counterparts and at least $7,000 less than women in any other sector.
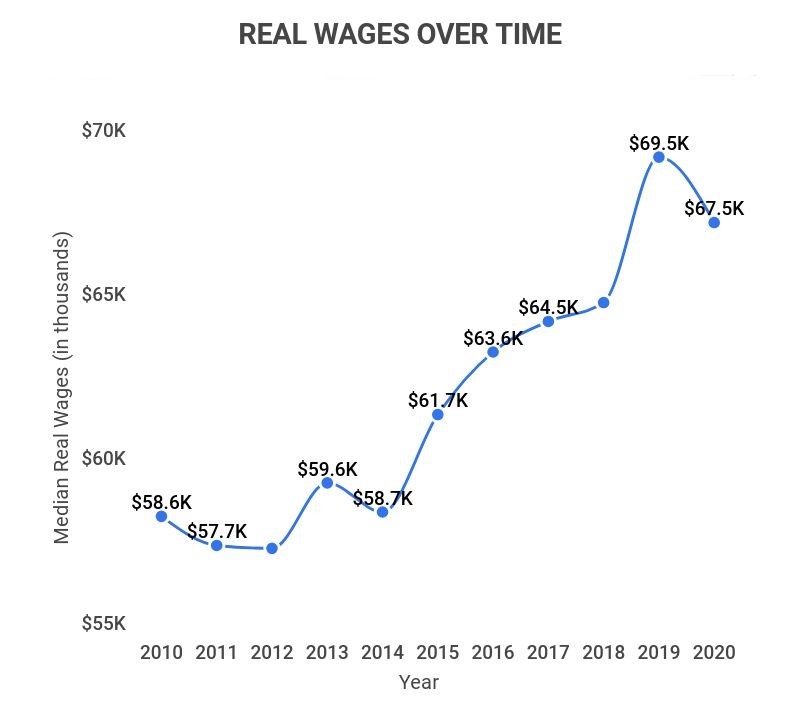
Real Wage Statistics
When adjusted for inflation and the number of goods and services that can actually be bought, we get an individual’s “real wage.” Overall, when it comes to real wages in the U.S., Here are the facts:
-
From 1964 to 2018, the average American’s real wage has only increased by $2.38.
When adjusted for inflation, the average wage of $2.50 in 1964 would equate to around $20.27. Meanwhile, the average wage as of 2018 was $22.65.
-
As of 2020, the average American real wage is $67,521.
That’s actually slightly lower than the average real wage in 2019, which was $69,560. Overall though, both of these averages are higher than the real wage at the tail end of the 2008 recession, which was only $60,200.
-
The United States has the sixth-highest real wages in the world.
The United States is still one of the highest-paying countries in the world, behind only Denmark, Australia, Sweden, Norway, and Luxembourg.
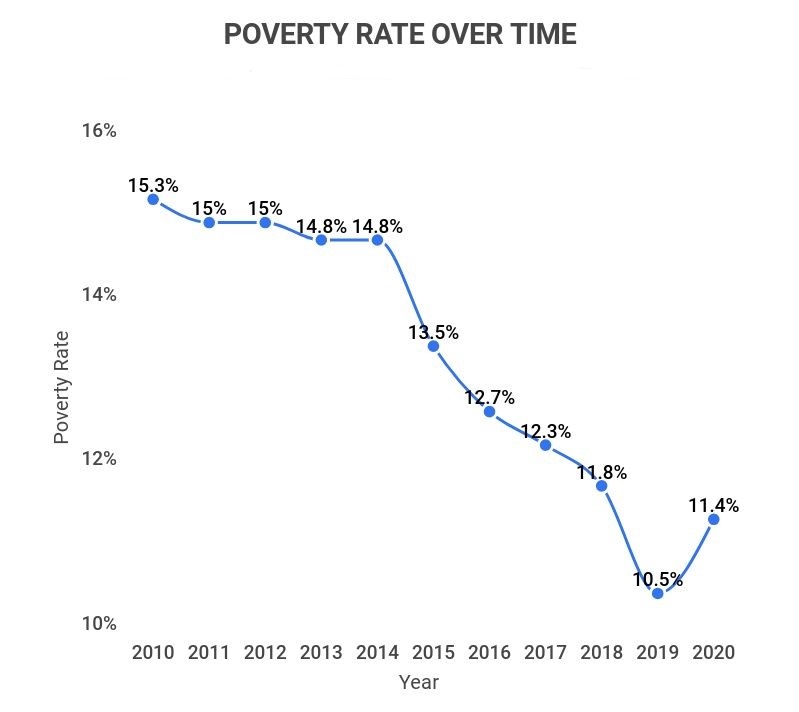
Poverty in America Statistics
Despite being the sixth highest income country in the world, there are still millions of Americans who struggle with poverty. For these individuals, the average income is a far cry from what they’ve come to expect. Here’s what we found:
-
As of 2020, 11.4% of Americans lived below the poverty line.
Which is a whole percentage point higher than it was in 2019. No doubt, this spike in poverty can be partially attributed to the effects of the COVID-19 Pandemic.
This number can also vary drastically by state, with states like New Mexico, West Virginia, and Mississippi all having adult poverty rates above 18%.
-
There are approximately 37.2 million Americans living in poverty.
With California accounting for over 12% of those numbers, with 5,163,814 living in poverty in the state.
-
The poverty rate for households in the U.S. is 4.7%.
Which is an increase of 0.7% from 2019, when the rate was only 4%. That’s around 7.3 million poor families living in the United States.
-
From 2010 to 2019, the poverty rate steadily dropped from 15.1% to 10.5%.
However, there was a sharp uptick in the poverty rate from 2019-2020, when it increased to 11.4%. These ups and downs aren’t unusual, though, as the poverty rate in 2000 was only 11.3%.
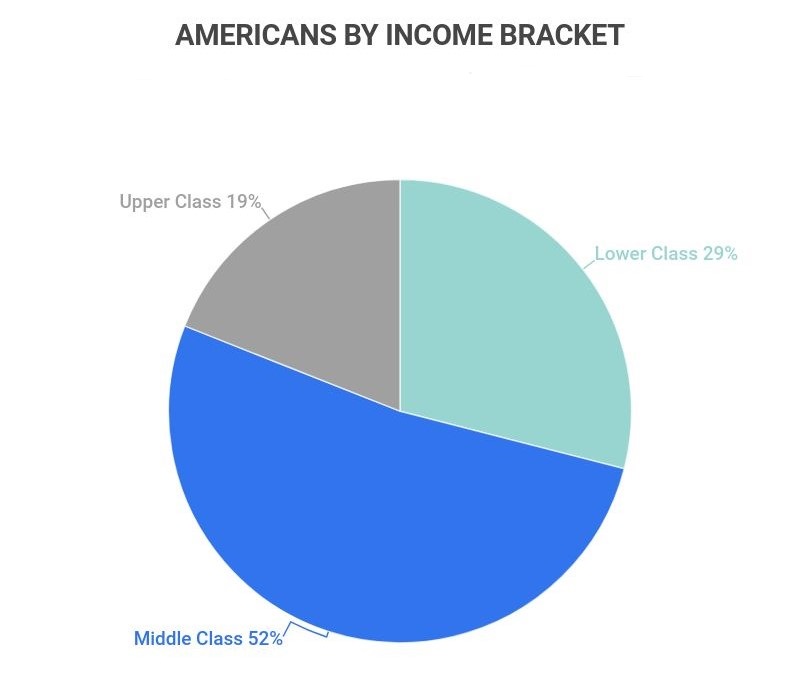
American Income Bracket Statistics
We’ve all heard the term “Middle Class,” but what exactly does that mean? Plus, there are several other income brackets in the U.S. as well. According to our research:
-
52% of Americans are considered “Middle Class.”
While 29% are considered “Lower Class,” and the smallest percent, 19% are considered “Upper Class.”
-
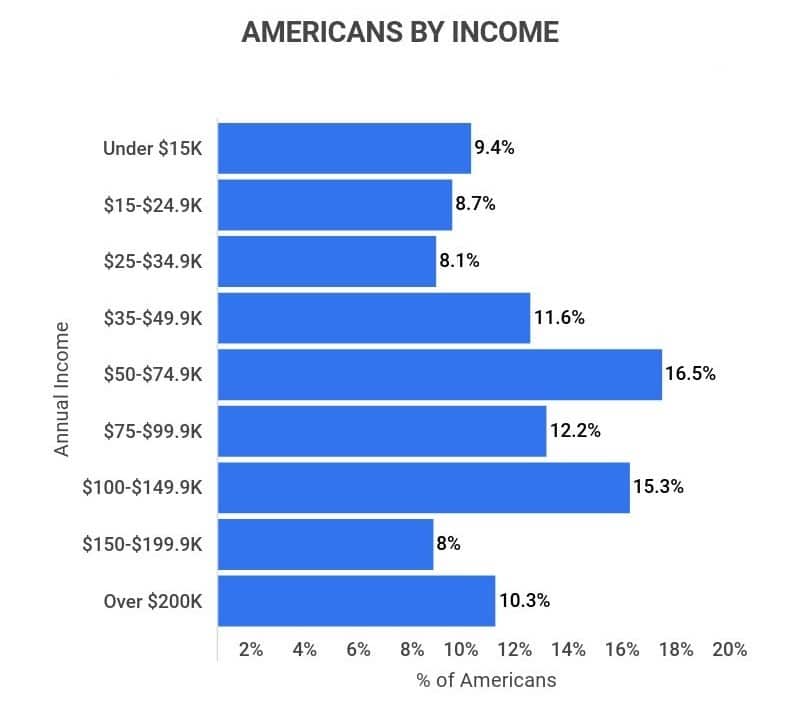
In the U.S., the Middle Class constitutes any income between $42,000 and $126,000.
Overall, the highest percentage of Americans (16.5%) have an income between $50,000-$74,999. With the second and third highest percentages being those who make between $75,000-$99,999 (12.2%) and $100,000-$149,000 (15.3%).
-
The top 10% earn 30.2% of the total income in the U.S.
Whereas the bottom 90% earn 69.8% of total income, meaning that there’s a huge divide between the average income and the income of the wealthiest individuals.
Average American Income Trends and Predictions
Now that we know where the average American income stands, let’s find out where it’s heading. After all, the average income (adjusted for inflation) has barely grown in over 50 years, so will that change anytime soon? According to our research:
-
From 2014-2020, the average median household income increased from $55,613 to $67,521.
Overall, the average income has increased sharply within the past five years, up until 2020. In 2019, the average household income was as high as $69,560 and would have likely kept growing if not for the COVID-19 Pandemic.
-
From 2014-2020, the real median income increased by 13%.
While there was a dip in real median income between 2019-2020, the overall trend over the past five years has been positive. As a whole, the median real income has increased since the 2008 recession.
-
Wages are expected to grow by 3% between 2021-2022.
Unfortunately, this number doesn’t keep up with inflation, which has grown by 6.2% in 2021 and is expected to grow further in 2022. In fact, overall wage growth hasn’t strayed much further from 3% in several years, despite inflation.
Average American Income by State
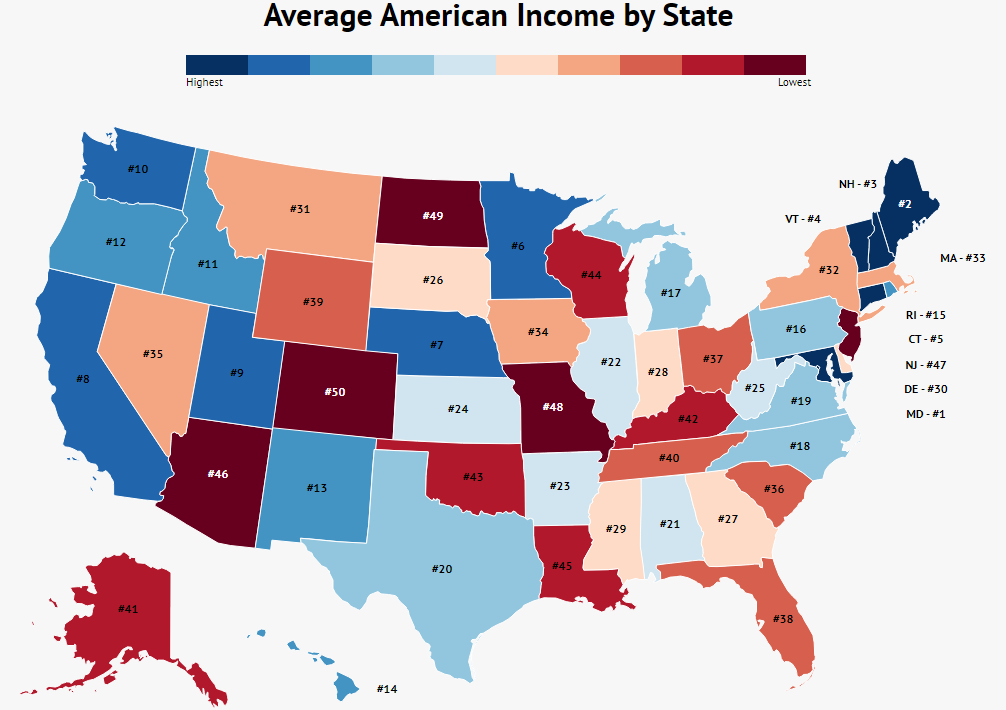
Where you live matters when it comes to income, to help understand the variations in income between different states, we’ve created a chart showing the average and median household income in each state:
| State | Average Income | Median Income |
|---|---|---|
| Alabama | $80,098 | $54,193 |
| Alaska | $95,705 | $74,509 |
| Arizona | $93,563 | $66,501 |
| Arkansas | $73,595 | $50,005 |
| California | $109,260 | $77,320 |
| Colorado | $11,730 | $82,427 |
| Connecticut | $112,717 | $78,481 |
| Delaware | $88,015 | $68,341 |
| District of Columbia | $134,879 | $87,539 |
| Florida | $80,986 | $57,333 |
| Georgia | $89,679 | $59,235 |
| Hawaii | $100,865 | $80,038 |
| Idaho | $86,823 | $66,235 |
| Illinois | $105,406 | $73,653 |
| Indiana | $93,692 | $66,200 |
| Iowa | $89,448 | $67,929 |
| Kansas | $92,077 | $72,695 |
| Kentucky | $79,926 | $55,761 |
| Louisiana | $75,323 | $50,079 |
| Maine | $87,585 | $64,054 |
| Maryland | $130,850 | $93,236 |
| Massachusetts | $127,044 | $86,000 |
| Michigan | $98,869 | $63,016 |
| Minnesota | $112,222 | $78,036 |
| Mississippi | $66,127 | $44,836 |
| Missouri | $89,400 | $62,000 |
| Montana | $87,696 | $56,180 |
| Nebraska | $98,805 | $72,099 |
| Nevada | $63,588 | $60,001 |
| New Hampshire | $111,787 | $88,130 |
| New Jersey | $119,883 | $85,110 |
| New Mexico | $72,198 | $50,489 |
| New York | $101,402 | $68,624 |
| North Carolina | $83,726 | $60,000 |
| North Dakota | $87,614 | $63,611 |
| Ohio | $82,814 | $60,000 |
| Oklahoma | $76,735 | $52,083 |
| Oregon | $104,543 | $76,000 |
| Pennsylvania | $100,056 | $70,002 |
| Rhode Island | $100,468 | $80,003 |
| South Carolina | $83,231 | $60,000 |
| South Dakota | $90,680 | $69,763 |
| Tennessee | $80,185 | $54,601 |
| Texas | $96,468 | $68,000 |
| Utah | $107,811 | $83,979 |
| Vermont | $98,588 | $67,345 |
| Virginia | $114,811 | $81,500 |
| Washington | $106,549 | $80,500 |
| West Virginia | $75,856 | $52,000 |
| Wisconsin | $91,538 | $66,900 |
| Wyoming | $80,389 | $65,002 |
Average American Income FAQ
-
What is the difference between income and salary?
The difference between income and salary is that a salary is a fixed income provided by an employer, while your income is money you’ve earned from any source. For example, your yearly income would combine all the money you earned from your salary, small online shop profits, and that antique dresser you sold.
-
What does “household income” mean?
Household income refers to the combined gross income of everyone who occupies the same house. This can even include teens as young as 15 years old, though it usually encompasses married couples.
-
What is the difference between average and median income?
The main difference between the average income and the mean income is how the data is extrapolated. The average (mean) income is the sum of all incomes divided by the count of incomes in the data set.
By contrast, the median income is simply the income in the middle of the data set, which can be determined by placing all the numbers in value order and working toward the center.
What this means is that the average income can easily be skewed by those who make the highest and lowest incomes. For example, if five people make between $40,000-$50,000 and one person makes $500,000, the average income will be skewed to just over $120,000.
On the other hand, the median income would still be between $40,000-$50,000, due to one of those incomes being the middle number.
-
What is the median income in the US in 2021?
The median income in the U.S. is $70,824, as of 2021. That’s up from $67,521 in 2020, and even from $69,560 in 2019.
-
What percentage of Americans make over $100,000 a year?
Approximately 33.6% of Americans make over $100,000 per year. 15.3% of that number are those who make between $100,000-$150,000, and only 0.1% make over a million per year.
-
What percentage of Americans live below the poverty line?
11.4% of Americans live below the poverty line. These Americans are defined as any 1-2 family household that makes less than $20,000 per year or any 3-4 family household that makes less than $30,000 per year.
When it comes to poverty, not every state is created equal either. States with larger populations, like California, have over 5 million people living in poverty. Statistically, though, New Mexico, West Virginia, and Mississippi are the only states with adult poverty rates of above 18%.
-
How much income do you have to earn to be in the 1%?
To be in the top 1% in the U.S., you’d need to have an income of at least $545,978. That’s still only halfway to being a millionaire, and the top 5 richest Americans all make over $50 billion per year (Bill Gates, Jeff Bezos, Warren Buffett, Mark Zuckerberg, etc.).
-
What is considered “middle class”?
Middle Class constitutes any income between $42,000 and $126,000 in the US. Overall, the highest percentage of Americans (16.5%) have an income between $50,000-$74,999.
-
What percentage of Americans live paycheck to paycheck?
At least 54% of Americans live paycheck to paycheck Shockingly, this doesn’t necessarily indicate a low income either. In fact, 40% of those making $100,000 or more say they live paycheck to paycheck.
-
What is “real wage”?
The real wage is the amount of money someone has when adjusted for inflation and the number of goods and services that can actually be bought. In the U.S., the real wage is currently $67,521. Believe it or not, the real hourly wage has only increased by just over $2 since 1964.
Here is an easy way to calculate the real wage:
-
Wages ÷ (1 + Inflation Rate) = Real Income
-
Conclusion
The truth is, anything from gender, race, age, occupation, or location can have a significant impact on your average salary. That said, the average personal income in the U.S. is $63,214, and the median income is $44,225.
These numbers are vital to helping gauge where you are in relation to others and as a means of understanding the economy as a whole.
After all, because the U.S. economy is heavily reliant on consumer spending (70%), the average income can tell us how much the average American is willing to spend. That’s why 54% of Americans living paycheck to paycheck is not only bad for individual people but also bad for the economy.
Either way, it seems the average income is starting to recover from its 2020 dip, which is a positive trend. However, it is important to keep in mind that growing inflation and wage stagnation will still be a considerable issue going forward as well.
Sources:
-
United States Census Bureau. “Sex by Class of Worker and Median Earnings in the Past 12 Months (in 2018 Inflation-Adjusted Dollars) for the Civilian Employed Population 16 Years and Over.” Accessed on January 5th, 2021.
-
Pew Research Center. “Gender pay gap in U.S. held steady in 2020.” Accessed on January 5th, 2021.
-
Insider. “These 8 charts show the glaring gap between men’s and women’s salaries in the US.” Accessed on January 5th, 2021.
-
Pew Research Center. “Asian Americans.” Accessed on January 5th, 2021.
-
United States Census Bureau. “Median Income in the Past 12 Months (in 2018 Inflation-Adjusted Dollars).” Accessed on January 5th, 2021.
-
United States Census Bureau. “Income and Poverty in the United States: 2018.” Accessed on January 5th, 2021.
-
Pew Research Center. “For most U.S. workers, real wages have barely budged in decades.” Accessed on January 6th, 2021.
-
FRED. “Real Median Household Income in the United States.” Accessed on January 6th, 2021.
-
BT. “Top 10 Average Income By Country In 2021 (Country Ranking).” Accessed on January 6th, 2021.
-
United States Census Bureau. “Income, Poverty and Health Insurance Coverage in the United States: 2020.” Accessed on January 6th, 2021.
-
Statista. “Number of families living below the poverty line in the U.S. from 1990 to 2020.” Accessed on January 6th, 2021.
-
Statista. “Poverty rate in the United States from 1990 to 2020.” Accessed on January 6th, 2021.
-
Pew Research Center. “Are you in the American middle class? Find out with our income calculator.” Accessed on January 6th, 2021.
-
Statista. “Percentage distribution of household income in the U.S. in 2020.” Accessed on January 6th, 2021.
-
Investopedia. “How Much Income Puts You in the Top 1%, 5%, 10%?” Accessed on January 6th, 2021.
-
Statista. “Median household income in the United States from 1990 to 2020.” Accessed on January 6th, 2021.
-
Statista. “2022 Salary Increases Look to Trail Inflation.” Accessed on January 6th, 2021.
-
DQYDJ. “Average Income by State plus Median and Top 1%.” Accessed on January 6th, 2021.
- Income Statistics
- Average PTO Days
- What Percentage of Americans Live Paycheck to Paycheck?
- Average American Income
- Millionaire Statistics
- Average Salary out of College
- Average Bonus Statistics
- Minimum Wage Statistics
- Union Benefits Statistics
- Savings Statistics
- Average Annual Raise
- Income Inequality Statistics
- How Many People Make Over 100k?
- Average 401(k) Sstatistics
- Average Net Worth Statistics
- $100k After-Tax Income By State
- Average Global Income
Author
Jack Flynn is a writer for Zippia. In his professional career he’s written over 100 research papers, articles and blog posts. Some of his most popular published works include his writing about economic terms and research into job classifications. Jack received his BS from Hampshire College.